

What you'll learn in this article
- What the used car market evolution actually looks like when you read it through Google Ads search demand, not headlines
- Why the head term "used car" is down 33% year over year and what that decline is really measuring
- How the pandemic-era peak distorted the curve and why the current cooldown is a normalisation, not a collapse
- The gap between high-intent buyer demand and research-stage demand, and why the two moved at different speeds
- What I watch in the account when a whole vertical's search volume is contracting under me
Most people read the used car market through price headlines. I read it through the search bar, because search intent moves before the transaction does and it's the earliest honest signal I get in an account. When I pull four years of demand for a term like "used car" in the United States, the shape on the chart tells a cleaner story than any market report: a category that surged during the shortage, peaked, and is now settling into something much cooler.
This is what the used car market evolution has looked like in the Keyword Planner data I work from, why the head term is dropping the way it is, and the handful of things I actually watch when an entire vertical is contracting underneath the campaigns I'm running.
The numbers I see in the demand data
Pulled for the US over the July 2022 to June 2026 window, the two terms that anchor this vertical read like this:
| Keyword | Avg. monthly searches | 3-month change | YoY change | Competition | Top-of-page bid (low) | Top-of-page bid (high) |
|---|---|---|---|---|---|---|
| used car | 673,000 | -18% | -33% | High | $0.48 | $2.24 |
| used car market | 9,900 | -18% | -18% | High | $0.45 | $2.08 |
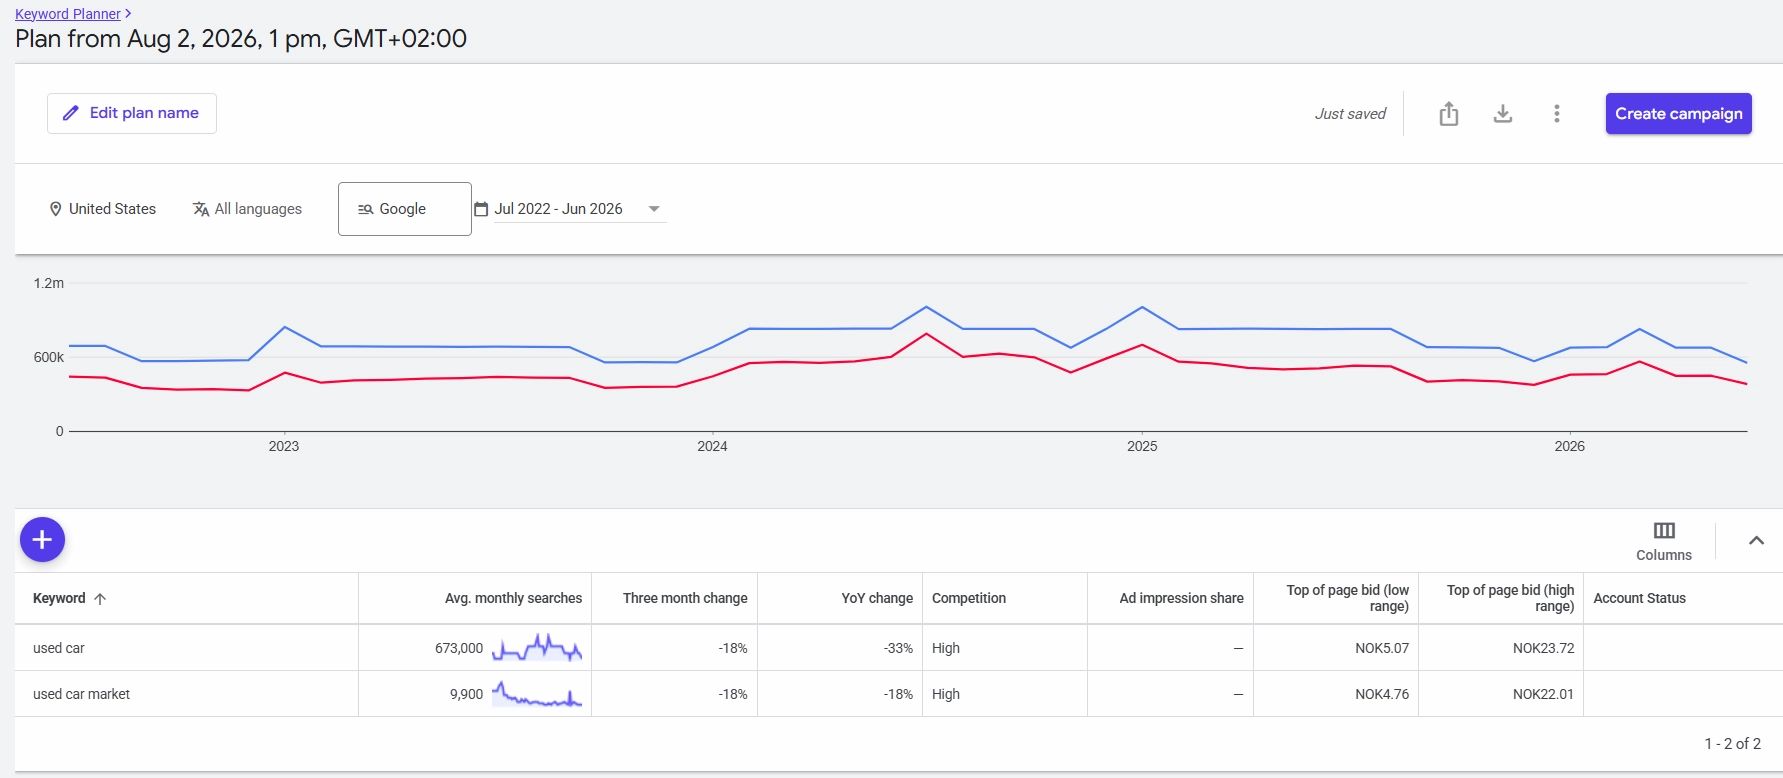
The head term still commands serious volume 673,000 average monthly searches is a large, valuable audience but it carries a 33% year-over-year decline and an 18% drop in the most recent three months. That's not a soft plateau. Demand is contracting, and the rate of contraction is accelerating relative to where it sat a year ago.
The shape of the curve, not the snapshot
The trend line is where the actual story lives. Through 2022 and 2023 volume ran high but jumpy the tail end of the pandemic distortion, with sharp seasonal spikes as buyers chased scarce inventory. It climbed to its highest sustained level across late 2024 into early 2025, then rolled over through 2025 and into 2026. A single month's figure tells you almost nothing here; the direction across the whole window is the point.
Buyer intent versus research intent
The two keywords aren't the same market. "used car" is transactional a person moving toward a purchase. "used car market" is research-stage, and it sits at a fraction of the volume. What matters is that they declined at different speeds: the transactional term fell 33% year over year while the research term fell 18%. Active buyers pulled back roughly twice as fast as the people merely studying the category, and that gap is the clearest evidence I have that this is a demand-side cooldown rather than the sector losing relevance.
Why used car demand moved the way it did
Four forces have shaped this curve, listed roughly by how much each one actually moved the number.
1. The pandemic peak was artificial
When new-vehicle production seized up, buyers were pushed into the used market in numbers the segment was never built to absorb. That inflated both prices and search demand well above any natural baseline. Everything since is partly a return from that peak the decline looks dramatic largely because the starting point was distorted upward.
2. New-car supply came back
As production normalised, incentives and financing offers returned to new vehicles the kind of shift automotive coverage like Torque Nation tracks closely. That pulled a slice of would-be used buyers back across to the new-car side, and you see it in the head term draining faster than the research term.
3. Price fatigue and rate sensitivity
Used prices that spiked during the shortage stayed stubbornly high, and elevated financing costs made a large discretionary purchase harder to justify. Buyers didn't vanish they delayed, and delayed intent shows up as falling search volume long before it shows up anywhere else.
4. Seasonality on top of the trend
The recurring spikes across every year are the normal rhythm of the category tax-refund season, year-end, and similar windows. They don't change the direction of the trend, but they'll wreck any month-on-month comparison that ignores them, which is why I always read this vertical year over year rather than reacting to the last thirty days.
What I watch when a whole vertical is cooling
Before drawing conclusions from a falling volume number, it's worth being precise about what Keyword Planner is giving you. Google's documentation on average monthly searches describes it as an average over the selected range, rounded and modelled and the trend it plots is the signal I actually trust, far more than any single month it reports.
Two consequences follow for a vertical in decline. Falling demand doesn't reduce competition automatically both these terms still show High competition despite the drop, meaning the advertisers who remain are fighting over a shrinking pool. And a lower search count is not a lower cost; it often means the same money now buys fewer, more contested clicks.
Impression share before volume
When category demand shrinks, the account metric that matters most isn't clicks, it's impression share. Holding or growing share of a smaller pool is a genuine win; watching absolute clicks fall while share stays flat is just the market moving, not the campaign failing. I separate those two before I judge any month.
Intent segmentation, not one bucket
The 33%-versus-18% split is a mandate to keep transactional and research queries in separate campaigns. If they share a budget, the cheaper research clicks quietly absorb spend that should have gone to the buyers who are actually converting. This is standard keyword hygiene, but a cooling market punishes neglecting it far harder.
Bid pressure against a shrinking pool
With competition staying High on falling volume, cost per click tends to hold up or rise even as demand drops. I pace budget against conversions and impression share rather than trying to defend a click-volume target that the market is no longer willing to supply.
Year-over-year framing, always
Because seasonality is so strong here, every comparison I make in this vertical is against the same month last year. A month-on-month read in used cars will tell you a story that the trend flatly contradicts.
What I infer from these numbers
This is normalisation, not decline. A 673,000-search head term isn't a dying category. The drop is largely the unwinding of an artificial pandemic peak, and read that way the trend is healthy rather than alarming.
Buyers left faster than researchers, which is the tell. The transactional term falling roughly twice as fast as the research term points to purchase intent cooling specifically people are still curious about the market, just less ready to buy into it right now.
Falling demand won't rescue your CPCs. High competition on shrinking volume is the classic squeeze: fewer searches, sustained bidding pressure, rising effective cost per acquisition. Anyone hoping the cooldown makes clicks cheaper has that backwards.
The trend line predicts better than the snapshot. If I had to plan a used-car budget on one thing, it would be the direction of the multi-year curve, not the average-searches figure sitting in the cell today.
Published market benchmarks lag the search data. Search intent shifts before transactions and before the reports that count them, which is why I cross-read the demand curve against longer-form market commentary like this Substack rather than waiting on the headline. The demand curve is the leading indicator; the headline is the confirmation.
What I stopped doing
Reading used-car demand month over month. The seasonality is strong enough that a single monthly comparison in this vertical is almost always misleading. Year over year, or nothing.
Treating a shrinking pool as a reason to cut bids reflexively. Competition here stayed High while volume fell. Backing off bids to chase a cheaper click just cedes the buyers who are still worth having.
Running transactional and research queries in one bucket. A -33% term and a -18% term behaving differently is the whole point they need separate campaigns so the decline in one doesn't get masked by the other.
Confusing the pandemic peak with a normal baseline. Judging today's demand against the 2024–25 crest makes any figure look like a catastrophe. The right comparison is the pre-distortion trend.
The practical takeaway
Don't ask whether used-car demand is falling it is, and the head term is down 33% year over year. Ask what kind of falling it is. Here it's the unwinding of an artificial peak on top of a still-large, still-valuable category, with buyer intent cooling faster than research interest and competition refusing to soften on the way down.
The used car market evolution comes down to a distorted peak, returning new-car supply, price and rate fatigue, and heavy seasonality roughly in that order. Once you can name which of those is moving your volume this quarter, the decline stops reading as a crisis and starts reading as a market returning to its own baseline something you can plan against deliberately rather than fear.